DCF Valuation of Companies
A two-stage template, and building it as a skill or an agent
Thu Sep 17, 2026
Overview
- Build a template for two-stage DCF
- But firm valuation is not “one size fits all,” so a spreadsheet template or a classical app is limited
- Create an agent skill
- Create a stand-alone agent
Template
| Input | Basis |
|---|---|
| Sales growth | |
| EBITDA margin | |
| Depreciation | % of prior year net PP&E |
| Cash tax rate | cash taxes / pretax income |
| Sales-to-NWC ratio | prior or average or ending NWC? |
| Sales-to-net PP&E ratio | prior or average net PP&E? |
| Cap ex | a plug |
Cash taxes: the provision less its deferred portion, or the taxes paid per the cash flow statement.
Issues (There Are Many)
- Value real estate, reserves, …
- Leases: financial or operating?
- Minority interests, investments in and income from affiliates
- Goodwill: constant or growing?
- Long-term deferred taxes: debt or equity?
- Other long-term assets and liabilities
- Derivative positions
- Preferred stock, convertible bonds, …
Skills
A folder with a SKILL.md in it — written instructions, plus any scripts and examples they refer to.
.claude/skills/dcf/
├── SKILL.md       a description, then the instructions
├── references/    the template, the issues
└── scripts/       code the agent can run
At startup Claude reads each skill’s description. When a task matches a skill, Claude reads that whole SKILL.md and follows it.
The Same File in Other Agents
Anthropic wrote the format and released it as an open standard. The others adopted it rather than inventing their own.
| Agent | Where it looks |
|---|---|
| Claude Code | .claude/skills/ |
| Codex and ChatGPT | .agents/skills/ |
| Gemini CLI | .gemini/skills/, or .agents/skills/ |
Same file, same description-first loading. Put the folder in .agents/skills/ and both Codex and Gemini CLI find it.
Creating a Skill
- Work with AI until you get what you want
- Tell AI to create a skill so you can get the same thing the next time
- Give the skill a meaningful name.
- As you use it and find things to add or modify, tell AI to edit the skill.
What Goes in the DCF Skill
The template lives here.
- Instructions for getting data, possibly including MD&A, risks from 10-K, earnings calls, news
- Instructions to use xlsx and pptx skills, any special formatting you want
- Guidelines for walking through other issues
Creating an Agent
- Stand-alone app
- API calls to large language model
- Could use Claude Agent SDK, though Claude can also write everything from scratch
The same SKILL.md works in Claude Code and inside the agent app.
Inside an Agent
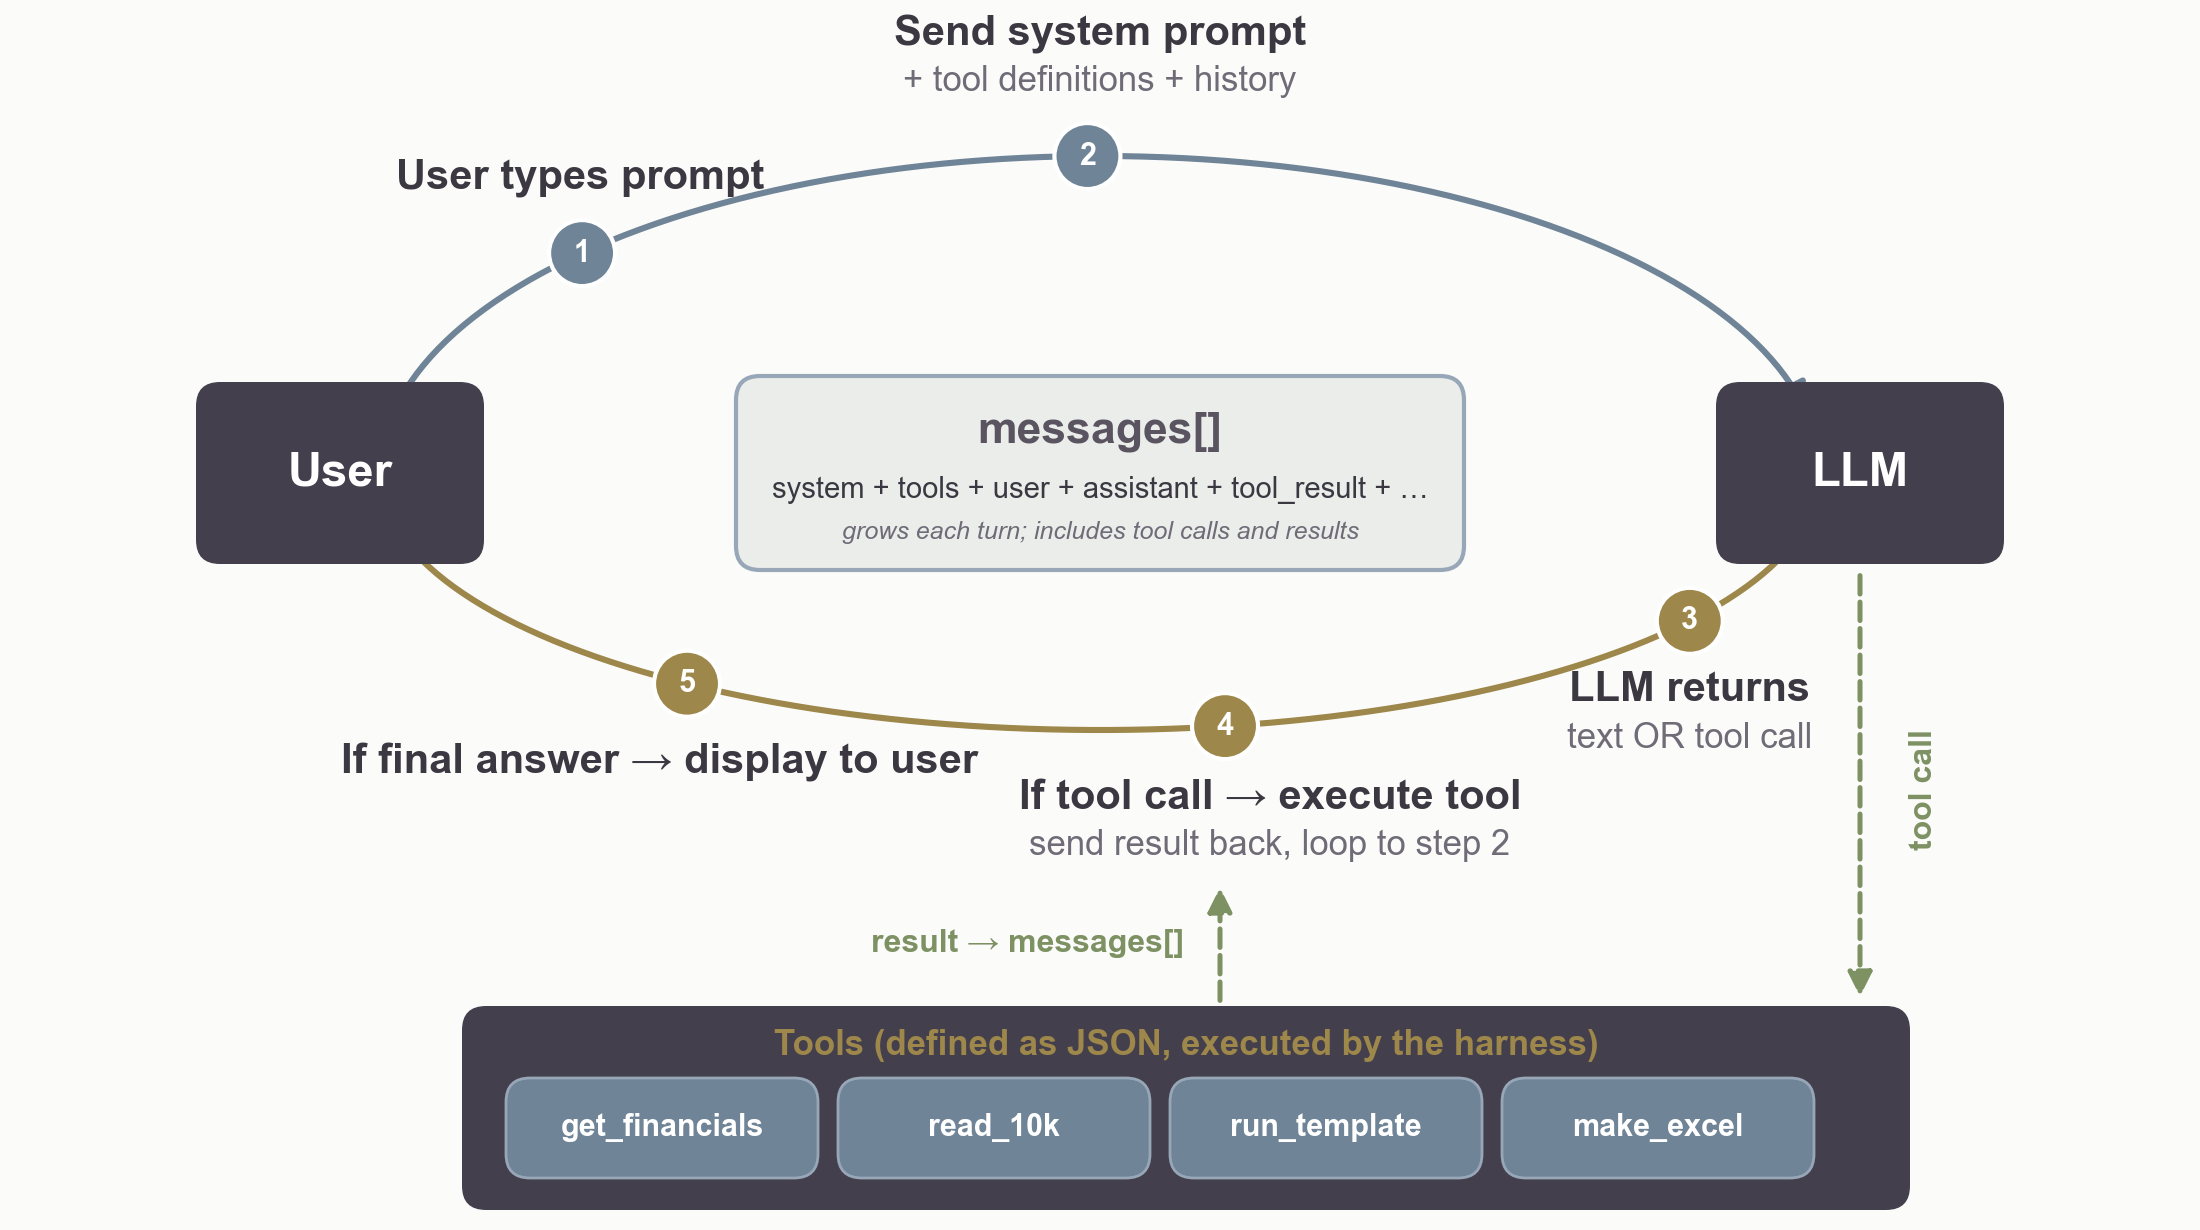
Claude Agent SDK
Three Varieties of Tools
Claude Code tools
The inherited built-ins — Read, Write, Edit, Bash, Grep, Glob, WebSearch, WebFetch, …
Internal MCP tools
Your own Python functions — run_python, or the valuation itself.
External MCP tools
Connectors — databases, the web, your inbox.
The LLM never runs anything. The harness — everything in an agent that is not the model — executes the tool the model asks for, or refuses.
Where They Run
| Read, Write, Edit, Bash, Grep | the agent’s own process — its filesystem, its shell, its network |
| Internal MCP tools | the same process — whatever it can import, it can run |
| External MCP tools | someone else’s server — arguments out over HTTP, only the result back |
WebSearch |
Anthropic’s search backend — titles and URLs, not pages |
WebFetch |
downloads from your machine, then a small model extracts what was asked |
So “on your machine” holds for the filesystem and shell tools. The two web tools are not local: the search runs at Anthropic, and the fetched page is sent there to be read.
The Deployed Agent
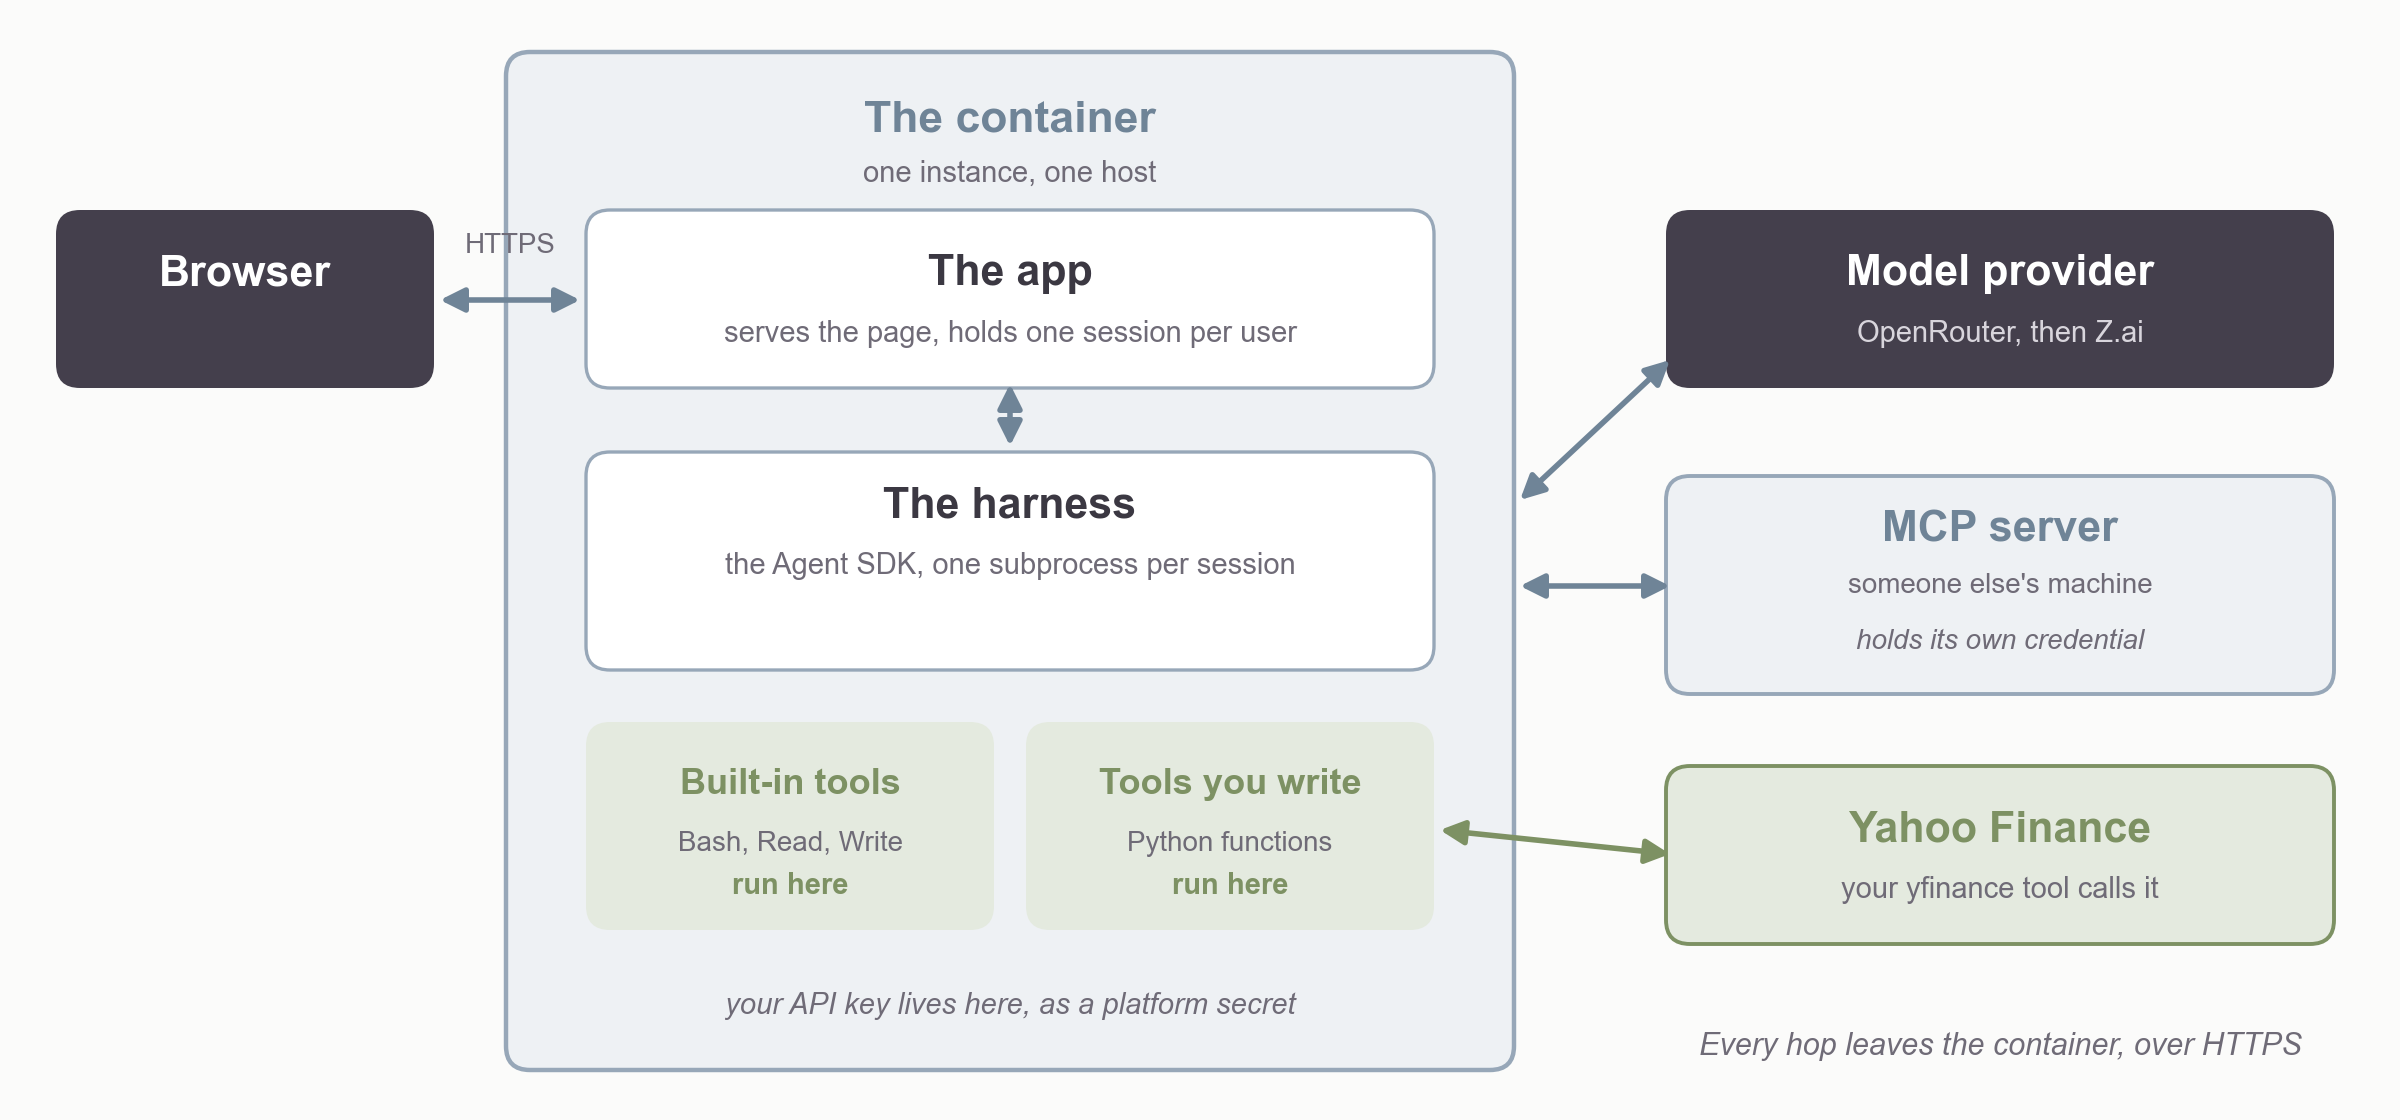
Agent Options
ClaudeAgentOptions |
|
|---|---|
system_prompt |
a string, or a file on disk when it is long |
tools |
which built-ins to include — tools=[] for none |
disallowed_tools |
takes a tool out of the model’s context entirely |
allowed_tools |
the tools that run without prompting |
mcp_servers |
the servers to connect, plus the one holding your tools |
max_turns |
how many tool-use round trips before the app stops it |
allowed_tools is not a whitelist. A tool left off it still runs — it falls through to permission_mode.
Permission Modes
permission_mode |
|
|---|---|
default |
prompts before file edits, shell commands, and network requests |
acceptEdits |
auto-approves edits and common filesystem commands |
plan |
read-only — proposes changes but makes none |
dontAsk |
only allowed_tools run; anything else is denied, not prompted |
bypassPermissions |
everything runs, no checks — sandboxed containers only |
Custom Tools
A Python function with a decorator giving its name, description, and arguments.
@tool(
    "get_financials",
    "Fetch a company's income statement, balance sheet and cash flow.",
    {"ticker": Annotated[str, "The stock's ticker symbol"]},
)
async def get_financials(args):
    t = yf.Ticker(args["ticker"])
    csv = t.income_stmt.to_csv()
    return {"content": [{"type": "text", "text": csv}]}
local_server = create_sdk_mcp_server(name="local", tools=[get_financials])
Tools fetch. The skill specifies the workbook, and the workbook’s own formulas do the arithmetic — so the valuation is not a tool.
Producing the Output
The workbook
The xlsx skill — pandas and openpyxl, plus a financial-modeling standard for formatting and formula conventions.
The deck
The pptx skill — markitdown and the pack scripts to edit a template, pptxgenjs under Node to build one from scratch.
The xlsx skill’s rule: formulas in the cells, not values computed in Python. =SUM(B2:B9), never the number Python got — so changing an assumption recalculates the workbook.
Skills are files in .claude/skills/, loaded when relevant. The container image has to carry what they import.
MGMT 638 · Gen AI and Quantitative Investments